All library locations will be closed on Friday, June 19, in observance of Juneteenth.
We have a new catalog! Check out this FAQ for tips on using it.
Fiscal Year 2026 - Year to Date

This includes physical checkouts and digital checkouts/borrows from our digital platforms. In Q1, DPL had 1,764,678 circulations and 1,797,196 circulations in Q2. Total circulation year to date is 3,561,874 at a +8.4% increase compared to FY25 during the same time.
Patrons completed 1,323,768 checkouts in Q1 and 1,336,287 in Q2. Year to date there has been 2,660,055 checkouts with a +10.8% increase compared to FY25 during the same time.

Digital Circulation consists of Hoopla and Overdrive digital checkouts/borrows. There were 440,910 checkouts/borrows during Q1 and 460,909 checkouts/borrows in Q2. Year to date, there have been 901,819 digital checkouts/borrows and +2% compared to FY25 during the same time.

Dallas Public Library issued 9,162 library cards in Q1 and 9,299 in Q2. Library card issuances closely mirror per month. Year to date, there have been 18,984 library card issuances with a -3.8% difference compared to FY25 during the same time.

Dallas Public Library welcomed 456,403 patrons in Q1 and 556,516 in Q2. Peak in February comes from those that came to vote. Year to date, DPL has had 1,012,919 visitors at a +16.9% increase compared to FY25 during the same time.
The following branches did not have working gate counters most of FY25:
-Hampton-illinois
-Highland Hills
-Lochwood
-Skyline
-Martin Luther King, Jr.
-Renner Frankford
Manual entries were included in January 2026 for these locations.
Programming & Services

62,204 patrons participated in 4,289 events during Q1. An overall average of 15 patrons per event in Q1.
64,526 patrons participated in 4,514 events during Q2. An overall average of 14 patrons per event in Q2.
High Attended Programs in Q1
Festival of Lights!
1,800
Vickery Park
Gift-away Saturday
791
Audelia Road
The Ramazinis Circus
642
Bookmarks
High Attended Programs in Q2
Get LIT! Adult Book Fair 3,200
Central
Lunar New Year Festival 1,256
Bookmarks
Fretz Park 50th Birthday Party
282
Fretz Park

In Q1, 4,560 adults participated in adult education classes and 5,270 in Q2. Year to date, there have been 9,830 participants at -17% compared to FY25 during the same time.

Patrons requested 76,839 computer sessions in Q1 and 75,629 in Q2. Year to date, there has been 152,468 computer sessions at -10% compared to FY25 during the same time.
FY 26 - Quarterly Data
Statistic | OCT | NOV | DEC | Q1 | % Change from FY25 Q1 | JAN | FEB | MAR | Q2 | % Change from FY25 Q2 | FY26-YTD Total | % YTD |
|---|---|---|---|---|---|---|---|---|---|---|---|---|
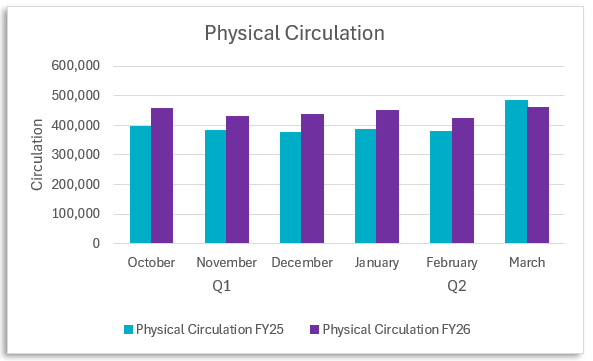
Physical Circulation | 457,512 | 429,004 | 437,252 | 1,323,768 | 14.7% | 451,023 | 423,811 | 461,453 | 1,336,287 | 7.2% | 2,660,055 | 10.79% |
Digital Circulation | 147,746 | 142,913 | 150,251 | 440,910 | -0.7% | 161,234 | 142,062 | 157,613 | 460,909 | 4.9% | 901,819 | 2.09% |
In-person visitors | 171,606 | 137,022 | 147,775 | 456,403 | 1.9% | 147,516 | 214,457 | 194,543 | 556,516 | 33.0% | 1,012,919 | 16.90% |
Virtual visitors | 146,684 | 165,316 | 272,023 | 584,023 | 40.6% | 512,709 | 351,916 | 211,986 | 1,076,611 | 111.1% | 1,660,634 | 79.47% |
New cardholders | 3,913 | 2,742 | 2,507 | 9,162 | -1.5% | 3,189 | 3,272 | 3,361 | 9,822 | -6.0% | 18,984 | -3.88% |
Number of programs | 1,715 | 1,289 | 1,285 | 4,289 | 27.5% | 1,284 | 1,514 | 1,716 | 4,514 | -7.5% | 8,803 | 6.75% |
Program attendance | 27,245 | 18,382 | 16,577 | 62,204 | 34.5% | 15,712 | 24,613 | 24,201 | 64,526 | -7.9% | 126,730 | 8.93% |
Adult learning participation | 2,578 | 1,210 | 772 | 4,560 | -15.7% | 1,157 | 2,285 | 1,828 | 5,270 | -19.0% | 9,830 | -17.50% |
Community Outreach | 24,234 | 7,564 | 8,838 | 40,636 | 59.3% | 5,290 | 5,112 | 8,684 | 19,086 | 80.8% | 59,722 | 65.56% |
Computer Sessions | 29,982 | 23,344 | 23,513 | 76,839 | -8.6% | 23,101 | 26,028 | 26,500 | 75,629 | -11.7% | 152,468 | -10.17% |
Volunteer Hours | 1,180 | 1,000 | 799.5 | 2,980 | -21.5% | 846.2 | 1,099.6 | 1,301.51 | 3,247 | -22.5% | 6,228 | -22.02% |
FY26-YTD Circulation
Location Type | FY25 Q1 | FY26 Q1 | % Change to FY25 Q1 | FY25 Q2 | FY26 Q2 | % Change to FY25 Q2 | FY25-YTD | FY26-YTD | % Change to FY25 YTD |
|---|---|---|---|---|---|---|---|---|---|
Neighborhood Library | 1,052,042 | 1,177,815 | 12% | 1,121,867 | 1,184,690 | 6% | 2,173,909 | 2,362,505 | 9% |
Central Library | 102,014 | 145,953 | 43% | 125,033 | 151,597 | 21% | 227,047 | 297,550 | 31% |
Total Physical Circulation | 1,154,056 | 1,323,768 | 15% | 1,246,900 | 1,336,287 | 7% | 2,400,956 | 2,660,055 | 11% |
Digital | 444,180 | 440,910 | -1% | 439,212 | 460,909 | 5% | 883,392 | 901,819 | 2% |
Systemwide | 1,598,236 | 1,764,678 | 10% | 1,686,112 | 1,797,196 | 7% | 3,284,348 | 3,561,874 | 8% |
Neighborhood Library | FY25 Q1 | FY26 Q1 | % Change to FY25 Q1 | FY25 Q2 | FY26 Q2 | % Change to FY25 Q2 | FY25-YTD | FY26-YTD | % Change to FY25 YTD |
|---|---|---|---|---|---|---|---|---|---|
Arcadia Park | 23,055 | 16,315 | -29% | 19,955 | 15,923 | -20% | 43,010 | 32,238 | -25% |
Audelia Road | 87,228 | 105,588 | 21% | 95,240 | 103,860 | 9% | 182,468 | 209,448 | 15% |
Bachman Lake | 21,297 | 22,328 | 5% | 20,530 | 22,158 | 8% | 41,827 | 44,486 | 6% |
Dallas West | 22,767 | 23,608 | 4% | 23,253 | 24,752 | 6% | 46,020 | 48,360 | 5% |
Forest Green | 41,057 | 44,468 | 8% | 42,570 | 43,116 | 1% | 83,627 | 87,584 | 5% |
Fretz Park | 99,226 | 121,852 | 23% | 107,613 | 122,311 | 14% | 206,839 | 244,163 | 18% |
Grauwyler Park | 9,790 | 9,439 | -4% | 8,922 | 9,682 | 9% | 18,712 | 19,121 | 2% |
Hampton Illinois | 56,169 | 62,257 | 11% | 56,247 | 64,509 | 15% | 112,416 | 126,766 | 13% |
Highland Hills | 10,872 | 11,794 | 8% | 12,666 | 11,774 | -7% | 23,538 | 23,568 | 0% |
Kleberg Rylie | 14,662 | 16,599 | 13% | 14,520 | 13,082 | -10% | 29,182 | 29,681 | 2% |
Lakewood | 84,125 | 113,462 | 35% | 96,968 | 118,067 | 22% | 181,093 | 231,529 | 28% |
Lochwood | 71,792 | 77,450 | 8% | 75,104 | 75,962 | 1% | 146,896 | 153,412 | 4% |
Martin Luther King, Jr. | 17,840 | 10,800 | -39% | 17,259 | 10,861 | -37% | 35,099 | 21,661 | -38% |
Mountain Creek | 18,710 | 26,006 | 39% | 19,199 | 25,591 | 33% | 37,909 | 51,597 | 36% |
North Park | 10,921 | 14,786 | 35% | 13,260 | 16,523 | 25% | 24,181 | 31,309 | 29% |
North Oak Cliff | 26,163 | 48,975 | 87% | 31,650 | 49,687 | 57% | 57,813 | 98,662 | 71% |
Oak Lawn | 40,309 | 53,382 | 32% | 46,649 | 52,792 | 13% | 86,958 | 106,174 | 22% |
Park Forest | 27,616 | 33,275 | 20% | 28,950 | 32,698 | 13% | 56,566 | 65,973 | 17% |
Paul Laurence Dunbar Lancaster-Kiest | 10,293 | 12,404 | 21% | 10,393 | 12,047 | 16% | 20,686 | 24,451 | 18% |
Pleasant Grove | 13,833 | 14,867 | 7% | 15,110 | 15,274 | 1% | 28,943 | 30,141 | 4% |
Polk Wisdom | 16,903 | 18,890 | 12% | 17,514 | 18,903 | 8% | 34,417 | 37,793 | 10% |
Prairie Creek | 26,696 | 26,223 | -2% | 27,580 | 29,562 | 7% | 54,276 | 55,785 | 3% |
Preston Royal | 83,335 | 96,042 | 15% | 92,077 | 98,260 | 7% | 175,412 | 194,302 | 11% |
Renner Frankford | 50,833 | 64,181 | 26% | 54,075 | 64,173 | 19% | 104,908 | 128,354 | 22% |
Skillman Southwestern | 54,707 | - | -100% | 60,177 | - | -100% | 114,884 | - | -100% |
Skyline | 13,565 | 17,023 | 25% | 13,852 | 16,695 | 21% | 27,417 | 33,718 | 23% |
Timberglen | 35,416 | 45,120 | 27% | 35,807 | 43,988 | 23% | 71,223 | 89,108 | 25% |
Vickery Park | 20,761 | 27,972 | 35% | 22,164 | 27,762 | 25% | 42,925 | 55,734 | 30% |
White Rock Hills | 42,101 | 42,709 | 1% | 42,563 | 44,678 | 5% | 84,664 | 87,387 | 3% |
Digital platforms | FY25 Q1 | FY26 Q1 | % Change to FY25 Q1 | FY25 Q2 | FY26 Q2 | % Change to FY25 Q2 | FY25-YTD | FY26- YTD | % Change to FY25 YTD |
|---|---|---|---|---|---|---|---|---|---|
Hoopla | 45,649 | 49,687 | 9% | 46,229 | 49,267 | 7% | 91,878 | 98,954 | 8% |
OverDrive | 398,531 | 391,223 | -2% | 392,983 | 411,642 | 5% | 791,514 | 802,865 | 1% |
Visitors FY26 Quarterly data
Location Type | FY25 Q1 | FY26 Q1 | % Change from FY25 Q1 | FY26 Q2 | FY25 Q2 | % Change from FY25 Q2 | FY25 YTD | FY26 YTD | % Change to FY25 |
|---|---|---|---|---|---|---|---|---|---|
Neighborhood Library | 375,522 | 348,433 | -7% | 446,209 | 335,478 | 33% | 711,000 | 794,642 | 12% |
Central Library | 72,420 | 107,970 | 49% | 110,307 | 83,092 | 33% | 155,512 | 218,277 | 40% |
In person total | 447,942 | 456,403 | 2% | 556,516 | 418,570 | 33% | 866,512 | 1,012,919 | 17% |
Virtual | 415,393 | 584,023 | 41% | 1,076,611 | 509,908 | 111% | 925,301 | 1,660,634 | 79% |
Systemwide | 863,335 | 1,040,426 | 21% | 1,633,127 | 928,478 | 76% | 1,791,813 | 2,673,553 | 49% |
Neighborhood Library | FY25 Q1 | FY26 Q1 | % Change from FY25 Q1 | FY25 Q2 | FY26 Q2 | % Change from FY25 Q2 | FY25 YTD | FY26 YTD | % Change to FY25 |
|---|---|---|---|---|---|---|---|---|---|
Arcadia Park | 11,073 | 9,401 | -15% | 10,728 | 7,999 | -25% | 21,801 | 17,400 | -20% |
Audelia Road** | 34,526 | 9,069 | -74% | 18,455 | 24,112 | 31% | 52,981 | 33,181 | -37% |
Bachman Lake | 10,515 | 10,590 | 1% | 11,987 | 11,673 | -3% | 22,502 | 22,263 | -1% |
Dallas West | 11,122 | 10,808 | -3% | 11,227 | 11,472 | 2% | 22,349 | 22,280 | 0% |
Forest Green | 32,845 | 28,417 | -13% | 33,815 | 19,048 | -44% | 66,660 | 47,465 | -29% |
Fretz Park | 21,893 | 21,359 | -2% | 27,177 | 23,157 | -15% | 49,070 | 44,516 | -9% |
Grauwyler Park | 4,784 | 5,487 | 15% | 5,303 | 7,014 | 32% | 10,087 | 12,501 | 24% |
Hampton Illinois* | - | 21,395 | N/A | - | 24,140 | N/A | - | 45,535 | N/A |
Highland Hills* | - | 4,101 | N/A | - | 16,329 | N/A | - | 20,430 | N/A |
Kleberg Rylie | 6,746 | 7,556 | 12% | 6,902 | N/A | N/A | 13,648 | N/A | N/A |
Lakewood | 18,709 | 20,397 | 9% | 20,307 | 19,456 | -4% | 39,016 | 39,853 | 2% |
Lochwood* | - | 6,975 | N/A | - | 29,516 | N/A | - | 36,491 | N/A |
Martin Luther King, Jr.* | - | - | N/A | - | 27,763 | N/A | - | 27,763 | N/A |
Mountain Creek | 17,032 | 9,135 | -46% | 7,260 | 12,349 | 70% | 24,292 | 21,484 | -12% |
North Park | 13,140 | 15,456 | 18% | 12,392 | 12,883 | 4% | 25,532 | 28,339 | 11% |
North Oak Cliff | 14,038 | 14,786 | 5% | 14,509 | 14,925 | 3% | 28,547 | 29,711 | 4% |
Oak Lawn | 35,223 | 20,623 | -41% | 16,704 | 27,691 | 66% | 51,927 | 48,314 | -7% |
Park Forest | 9,240 | 8,186 | -11% | 9,785 | 9,388 | -4% | 19,025 | 17,574 | -8% |
Paul Laurence Dunbar Lancaster-Kiest | 19,457 | 12,528 | -36% | 10,358 | 17,341 | 67% | 29,815 | 29,869 | 0% |
Pleasant Grove | 10,544 | 9,583 | -9% | 10,925 | 11,538 | 6% | 21,469 | 21,121 | -2% |
Polk Wisdom | 11,549 | 12,197 | 6% | 11,506 | 12,559 | 9% | 23,055 | 24,756 | 7% |
Prairie Creek | 15,337 | 13,655 | -11% | 15,883 | 14,234 | -10% | 31,220 | 27,889 | -11% |
Preston Royal | 16,717 | 17,068 | 2% | 17,829 | 16,830 | -6% | 34,546 | 33,898 | -2% |
Renner Frankford* | - | 9,707 | N/A | - | 22,004 | N/A | - | 31,711 | N/A |
Skillman Southwestern | 11,592 | - | -100% | 12,554 | - | -100% | 24,146 | - | -100% |
Skyline*** | 2,047 | 1,352 | -34% | 1,131 | 1,886 | 67% | 3,178 | 3,238 | 2% |
Timberglen | 10,836 | 11,122 | 3% | 12,156 | 12,392 | 2% | 22,992 | 23,514 | 2% |
Vickery Park | 23,700 | 25,404 | 7% | 23,258 | 23,369 | 0% | 46,958 | 48,773 | 4% |
White Rock Hills | 12,857 | 12,076 | -6% | 13,327 | 13,117 | -2% | 26,184 | 25,193 | -4% |
Kleberg-Rylie temporarily closed
* No working gate count during FY25. Manual count used beginning FY26 Jan
** Gate counter issue starting mid Oct 2025.
***Only has 1 working gate counter.